Debugging your protocols with DCE
Gdb
It is possible to use gdb to debug a script DCE/ns-3. As explained somewhere in the execution of a script is monoprocess, then you can put breakpoints in both sources of DCE and those of binaries hosted by DCE.
Install
Although it is not strictly necessary, it is recommended that you recompile a CVS Gdb for use with ns-3-dce. First, download:
cvs -d :pserver:anoncvs@sourceware.org:/cvs/src login {enter “anoncvs” as the password} cvs -d :pserver:anoncvs@sourceware.org:/cvs/src co gdb
Note that you might consider looking at http://sourceware.org/gdb/current/ to obtain more efficient (cpu/bandwidth-wise) download instructions.
Anyway, now, you can build:
cd gdb
./configure
make
And, then, invoke the version of gdb located in gdb/gdb instead of your system-installed gdb whenever you need to debug a DCE-based program.
Using
If you use gdb (a CVS or stable version), do not forget to execute the following command prior to running any DCE-based program:
(gdb) handle SIGUSR1 nostop
Signal        StopPrintPass to programDescription
SIGUSR1       NoYesYesUser defined signal 1
(gdb)
An alternate way to do this and avoid having to repeat this command ad-nauseam involves creating a .gdbinit file in your ns-3-dce directory and putting this inside:
handle SIGUSR1 nostop
or it can be put on the command line using the “-ex” flag:
./waf --run SCRIPT_NAME_HERE --command-template="gdb -ex 'handle SIGUSR1 nostop noprint' --args %s <args>"
Setup Eclipse Remote Debugging Environment
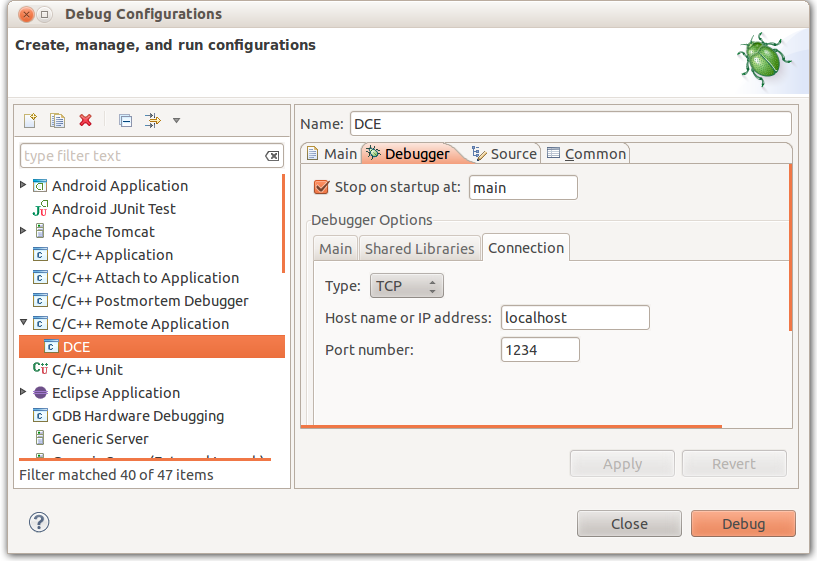
To remotely debug a DCE script you can use gdbserver as in the following example, changing the host name and port (localhost:1234):
./waf --run dce-httpd --command-template="gdbserver localhost:1234 %s <args>"
Then you can point a gdb client to your server. For example, in the following figure is reported an Eclipse debug configuration:
Once you start the debug session, you can use the usual Eclipse/gdb commands.
Helpful debugging hints
There are a couple of functions which are useful to put breakpoints into:
- ns3::DceManager::StartProcessDebugHook
Put a breakpoint in a specific node in a simulation
If you got a trouble in your protocol during interactions between distributed nodes, you want to investigate a specific state of the protocol in a specific node. In a usual system, this is a typical case of using distributed debugger (e.g., ddt, or mpirun xterm -e gdb –args xxx), but it is annoying task in general due to the difficulty of controlling distributed nodes and processes.
DCE gives an easy interface to debug distributed applications/protocols by the single-process model of its architecture.
The following is an example of debugging Mobile IPv6 stack (of Linux) in a specific node (i.e., home agent). A special function dce_debug_nodeid() is useful if you put a break condition in a gdb session.
(gdb) b mip6_mh_filter if dce_debug_nodeid()==0
Breakpoint 1 at 0x7ffff287c569: file net/ipv6/mip6.c, line 88.
 <continue>
(gdb) bt 4
#0  mip6_mh_filter (sk=0x7ffff7f69e10, skb=0x7ffff7cde8b0)
    at net/ipv6/mip6.c:109
#1  0x00007ffff2831418 in ipv6_raw_deliver (skb=0x7ffff7cde8b0,
    nexthdr=135)
    at net/ipv6/raw.c:199
#2  0x00007ffff2831697 in raw6_local_deliver (skb=0x7ffff7cde8b0,
    nexthdr=135)
    at net/ipv6/raw.c:232
#3  0x00007ffff27e6068 in ip6_input_finish (skb=0x7ffff7cde8b0)
    at net/ipv6/ip6_input.c:197
(More stack frames follow...)
Valgrind
(FIXME: simple session using valgrind)